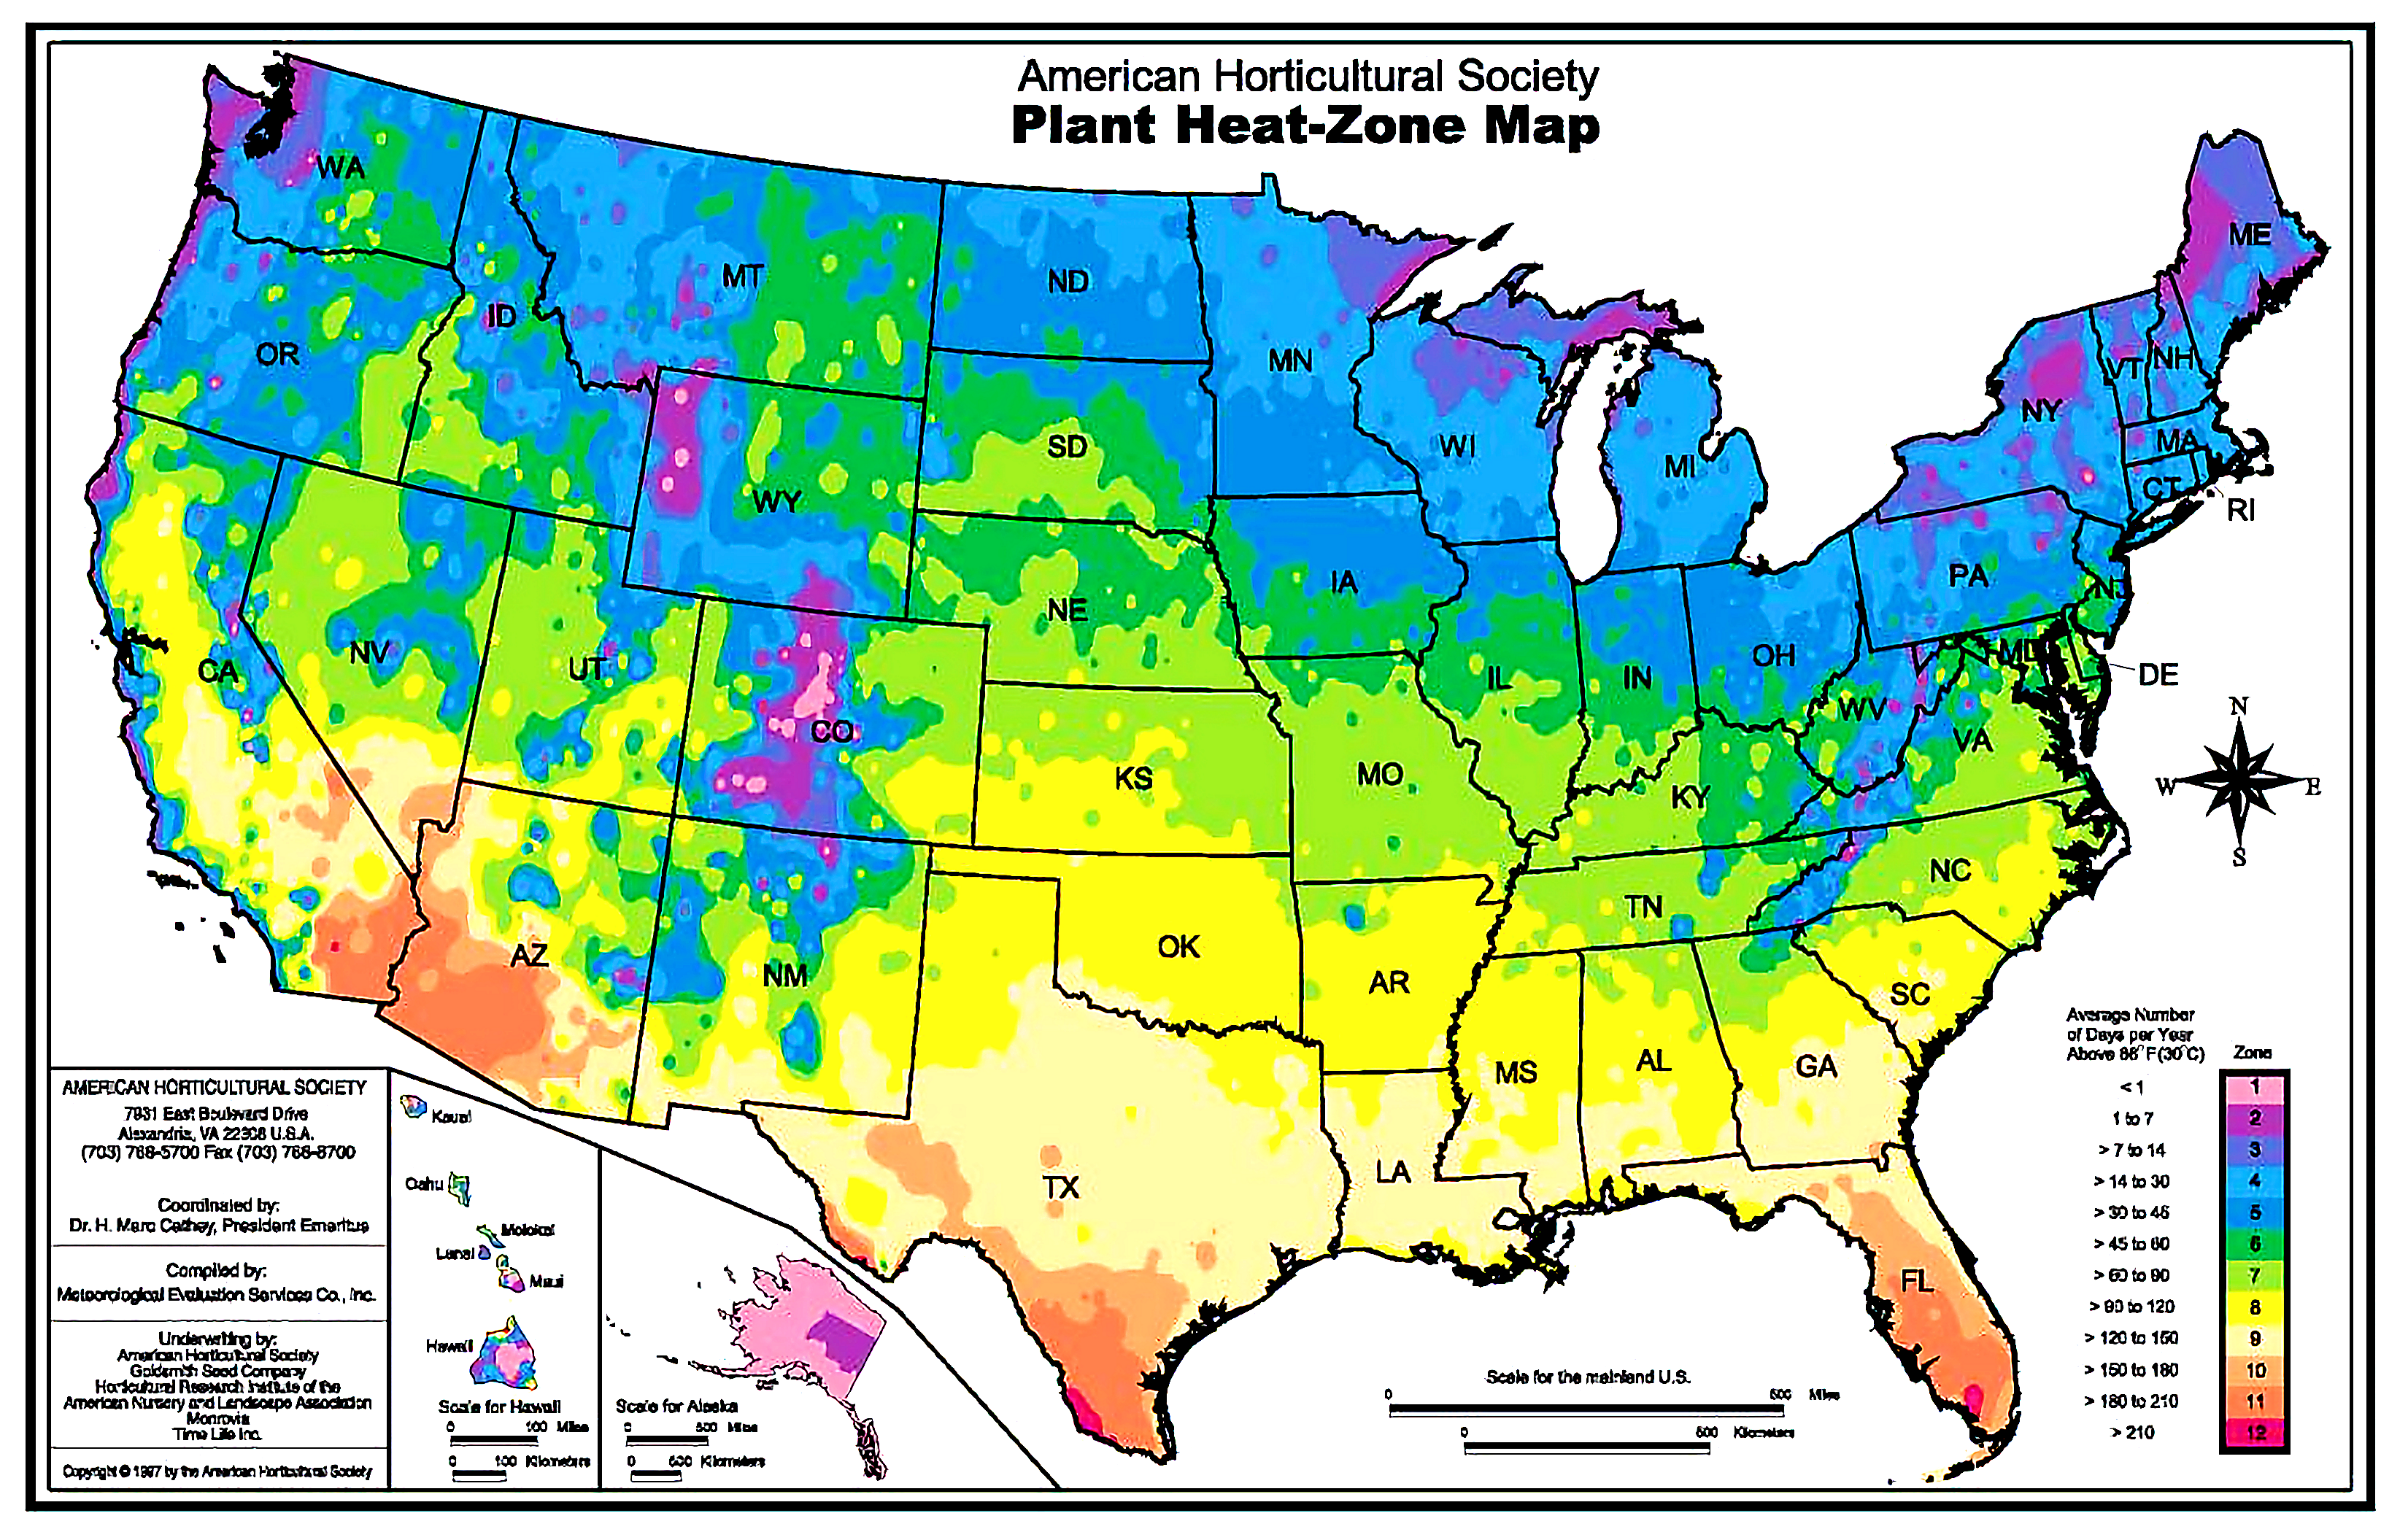
Created by the then president of the American Horticultural Society, H. Marc Cathey, in 1997 the heat zone map was created as a complementary map to the USDA plant hardiness map, which maps the coldest average annual temperature for a given region. Being a relatively newer map, heat zone information isn’t found in all plant or seed catalogs or tagged on all nursery plants and garden varieties. When it does appear it is often featured after the plant hardiness zone information, giving the plant a two-part number code denoting the appropriate cultivation region according to both statistics.
Similar to the plant hardiness map, the heat zone map is made up of 12 zones (the plant hardiness map has 13) based on the average number of “heat days” an area experiences in a year. A “heat day” is defined as a day in which the temperature climbs to over 86℉ (30℃): A zone 1 area has no heat days, whereas a zone 12 area has 210 or more. Daily high temperatures recorded by the National Weather Service between 1974 and 1995 were used to create the map. Since it hasn’t been updated since its release in 1997, it would be interesting to see what shifts, if any, have occurred, especially in light of the zone shifts in the recently updated plant hardiness map.

Offering annuals, perennials, accent plants, hanging baskets and other planted containers from the greenhouse in Deer Lodge, Montana. Trees and shrubs, as well as other specialty plants, including garden hard goods are available depending upon season.